Royalty Rate Benchmarking with Comparable Licensing Data
By Ivan Gowan· 2026-03-30royalty rate benchmarkingroyalty ratesroyalty rate by industrycomparable licensing datarelief from royaltyinterquartile rangetransfer pricingintangible asset valuation
Royalty rate benchmarking is the process of deriving the royalty a willing licensee would pay for an intangible asset from comparable arm's-length licences. The comparables are found in licensing databases, public filings and court decisions, screened for relevance, adjusted for differences, and summarised as a range, usually the interquartile range, from which one rate is selected and then tested against the profits the asset actually earns. Because a relief from royalty method valuation is proportional to the rate, the benchmark sets the value more directly than any other input.
Last reviewed: October 2026. Written for UK valuation practice (purchase price allocations under IFRS 3 or FRS 102, impairment testing, transfer pricing and IP lending). Much of the evidence base is international, chiefly US filings and court decisions, and the page says where it relies on it. General information, not tax or legal advice. All example figures are illustrative.
1 ÷ ratethe share by which value moves per percentage point of royalty: 25% at a 4% rate
IQR + medianthe statistical tools the OECD Transfer Pricing Guidelines name for narrowing a range (paras 3.57, 3.62)
2011the year a US appeals court rejected the 25% rule of thumb in Uniloc v Microsoft
What Royalty Rate Benchmarking Is, and Why the Rate Matters
A royalty rate is the percentage of revenue a licensee pays a licensor for the right to use an asset such as a brand, patent or piece of software. Relief from royalty values an asset the owner already holds by asking what it would cost to license it instead: projected revenue times the royalty rate, less tax, discounted over the asset's useful life.
That structure makes the value strictly proportional to the rate. Moving from 4% to 5% raises the value by a quarter (1 ÷ 4); moving from 10% to 11% raises it by a tenth. No other single input in the method has so direct an effect, which is why auditors, HMRC transfer pricing teams and opposing experts concentrate their questions on it.
📚 Definition
Royalty rate benchmarking is the documented derivation of an arm's-length royalty rate from comparable licensing transactions: search, screen, adjust, summarise as a range, select a point, and cross-check against the profits of the business that would pay it.
A benchmarked rate is needed wherever the method is used: allocating the price of an acquisition to brands and technology, testing those assets for impairment, pricing intra-group licences for transfer pricing, valuing IP offered as loan collateral, and quantifying damages. The purpose changes where in the range you land (a lender will want the low end), but not how the range is built.
Royalty rates feed most IP valuation work through the relief from royalty method.
The Royalty Rate Benchmarking Process, Step by Step
1. Define the subject asset and the licence you are pricing
What is licensed, in which territory, exclusive or not, for how long, at what stage of development, and on what royalty base (net sales, gross profit or units). Every later screen depends on this.
2. Search for comparable licensing data
Run documented searches across commercial royalty databases, public filings and court decisions, recording the search terms and the number of agreements returned.
3. Screen the results
Reject agreements that fail the comparability screens, and record why each one was rejected.
4. Adjust the retained comparables
Correct for quantifiable differences in exclusivity, territory, bundled services and payment structure.
5. Summarise as a range and select a rate
Take the interquartile range and median, then choose a point justified by the subject asset's relative strength.
6. Cross-check and document
Test the rate against the licensee's margin and a fair return on its own assets, then write it up so a reviewer can repeat every step.
Where Comparable Licensing Data Comes From
Royalty rates are not quoted on an exchange. They have to be inferred from licensing agreements that were mostly negotiated in private, so the first task is finding agreements whose terms were disclosed.
Sources of comparable licensing data
Source type
What it provides
Main limitation
Commercial royalty databases
Searchable licence agreements with extracted rates and terms. Examples include RoyaltyStat, ktMINE, RoyaltyRange, Markables (brand and trademark comparables) and RoyaltySource
Coverage differs by product, region and asset type; check what each actually holds for your sector
US SEC filings
Listed companies file material contracts as exhibits (Regulation S-K, Item 601(b)(10)), and many licences are found this way
Rates and other commercial terms are often redacted; agreements skew to US companies
Court decisions
Reasoned royalty determinations in patent damages and licensing disputes
Litigated rates reflect the dispute, not a voluntary bargain
Intra-group licence benchmarks prepared for tax authorities
Usually confidential; may reflect tax planning
The subject's own licences
Rates the owner has agreed with third parties for the same asset
Rarely available, but the most comparable evidence there is
Court decisions deserve a note. In the US, the fifteen factors set out in Georgia-Pacific Corp. v. United States Plywood Corp. (S.D.N.Y. 1970) are still widely applied to set a reasonable royalty in patent damages, and judgments applying them publish the reasoning behind a rate. In the UK, the Supreme Court confirmed in Unwired Planet v Huawei [2020] UKSC 37 that the English courts can set the terms of a global licence of standard-essential patents on fair, reasonable and non-discriminatory (FRAND) terms; the resulting judgments, which work from comparable licences, are public evidence of how rates are derived.
ℹ Note
No single source is complete. A benchmark built from one database, with no record of the searches run and no account of rejected agreements, is the first thing a reviewer will challenge. Using two sources and keeping the search log is cheap insurance.
Screening Comparables
A search typically returns dozens of agreements; only a handful survive screening. The screens below follow the comparability features the OECD Transfer Pricing Guidelines identify for intangibles (Chapter VI, paras 6.117 to 6.126), which apply in the UK because UK transfer pricing law is read consistently with those Guidelines (TIOPA 2010, s164).
Comparability screens for licensing agreements
Screen
Question to ask
Typical reason to reject
Asset type
Is the licensed asset the same kind as the subject?
A technology licence used to price a brand
Industry
Does the licensee sell into the same or a similar market?
Different margin structure
Geography and territory
Same region and comparable territorial scope?
Worldwide rights used to price a UK-only asset, without adjustment
Exclusivity
Exclusive or non-exclusive?
Difference too large to quantify
Term and date
Comparable duration; signed within a period when market conditions were similar?
An agreement too old to reflect current conditions
Stage of development
Is the licensed product commercially proven, as the subject is?
An early-stage licence used to price an established product
Royalty base
Rate on net sales, gross profit or units?
A base that cannot be converted to the subject's
Bundled rights
Does the fee also pay for know-how, services or supply?
Bundle that cannot be separated from the IP
Adjusting the Selected Comparables
Retained comparables rarely fit exactly. Adjust for differences you can quantify; exclude those you cannot.
Common comparability adjustments
Adjustment
Direction
Rationale
Exclusivity
Up if the subject is exclusive and the comparable is not
Exclusive rights exclude competitors and are worth more
Territory
Up for a broader territory, down for a narrower one
Wider rights reach more revenue
Bundled services
Down to strip out services, marketing or supply
Isolates the payment for the IP
Upfront payments
Convert lump sums into a running-royalty equivalent
Makes deals with different payment structures comparable
Cross-licensing
Usually up
Reciprocal rights understate the cash rate
Bargaining position
Case by case
A distressed licensor may accept a lower rate
⚠ Warning
Record the size of every adjustment and the evidence for it. "Adjusted upward for exclusivity" is not enough; "+0.5 percentage points, based on the observed spread between exclusive and non-exclusive licences in the same search" is. If the adjustments become larger than the data, drop the comparable.
Applying the Range: Interquartile Range and Median
Even after screening and adjustment, some differences between the comparables and the subject will remain that cannot be identified or measured. The OECD Transfer Pricing Guidelines accept that, where the range includes a sizeable number of observations, statistical tools such as the interquartile range can improve reliability (para 3.57), and that a measure of central tendency such as the median can be used to choose a point within it (para 3.62).
The interquartile range is the middle half of the adjusted rates: it discards the bottom and top quarters, which limits the influence of an outlier without deleting it. Two practical points follow. First, quartile conventions differ: spreadsheet functions interpolate between observations, while the "median of each half" convention does not, and on a small set the bounds can differ by a tenth of a point or more. State the convention you used. Second, the median is a default, not an obligation: a subject asset that is demonstrably stronger or weaker than the typical comparable can justify a point elsewhere in the range, provided the reason is written down.
Royalty Rate by Industry: What Drives the Differences
Searches for royalty rates by industry are common, and so are tables of "typical" ranges. Treat any such table with care: a range without a stated source, date and sample cannot be defended to an auditor or to HMRC, and it says nothing about your asset. What can be stated is why rates differ.
What pushes royalty rates up or down
Driver
Tends to push rates up
Tends to push rates down
Licensee margins in the sector
High-margin products leave room for a larger royalty
Thin-margin sectors such as grocery or distribution cap the royalty
Strength and protection of the IP
Granted rights with long remaining life; well-known brands; technology that is hard to design around
Unregistered rights, ready substitutes, short remaining life
Contribution to the product
The IP is the reason customers buy
The IP is one input among many, such as one component patent in a complex device
Industry licensing practice
Sectors where licensing is routine and terms are commonly disclosed
Sectors with FRAND commitments, cross-licensing or royalty stacking
The margin driver sets a ceiling. A licensee cannot rationally pay a royalty that leaves it less than a fair return on its own assets, so a rate approaching the licensee's operating margin is a red flag, whatever a database says. This is why royalty rates for software and branded pharmaceutical products tend to sit well above those for industrial processes or grocery brands: the margins they come from are different.
★ Key Takeaway
A defensible royalty rate is not taken from an industry table. It is derived from screened and adjusted comparables, summarised as a range, and shown to leave the licensee a fair return. The documentation from search to selected rate is what makes it hold up under review.
Cross-Checks: the 25% Rule, Profit Split and Return on Capital
The 25% rule, and why it is no longer a benchmark
The 25% rule of thumb, commonly attributed to the licensing practitioner Robert Goldscheider, held that a licensee would pay about a quarter of its expected operating profit from the licensed product as a royalty. For decades it was used as a starting point in US patent damages and in licensing negotiations.
In Uniloc USA, Inc. v. Microsoft Corp. (decided 4 January 2011), the US Court of Appeals for the Federal Circuit held that the 25% rule is "a fundamentally flawed tool for determining a baseline royalty rate in a hypothetical negotiation", and that evidence relying on it is inadmissible under Daubert and the Federal Rules of Evidence because it is not tied to the facts of the case. For tax, the OECD Transfer Pricing Guidelines take the same position: a rule of thumb cannot be used to show that an apportionment of income between a licensor and a licensee is arm's length (paras 2.10 and 6.144). The rule survives as history, not as evidence.
Profit split as a sense check
Divide the selected rate by the licensee's expected operating margin before royalty. The result is the share of operating profit the rate hands to the licensor. There is no correct share, but it must be explainable by what each party contributes: a rate that gives the licensor most of the profit needs an asset that does most of the work. This is a sense check on a benchmarked rate. It is not the OECD's transactional profit split method, which divides the actual combined profits of related parties by their contributions.
Return on the licensee's own assets
Deduct the royalty, and then a fair return on the licensee's own contributory assets (working capital, fixed assets, workforce and its other intangibles), from the operating margin. If nothing is left, the licensee would earn less than its cost of capital and would not sign. The contributory charges are the same ones used in the multi-period excess earnings method, which makes this the natural bridge between the two methods.
Worked Example: Eight Comparables to a Selected Rate
The subject is the trade name of a UK premium pet-food business: £20.0m of annual sales, an operating margin of 14.0% before any royalty, sold in the UK only. A search across two databases returns 46 brand licences; 38 are rejected on the screens above (wrong asset, bundled supply, rate redacted, or signed more than ten years earlier). Eight remain.
The eight comparables after adjustment
Comparable
Licence
Raw rate
Adjustment
Adjusted rate
A
Pet accessories brand, UK, exclusive
1.5%
none
1.5%
B
Pet food brand, UK and Ireland, exclusive
2.6%
none
2.6%
C
Pet food brand, Europe, non-exclusive
2.5%
+0.5 (exclusivity)
3.0%
D
Premium food brand, UK, exclusive
3.4%
none
3.4%
E
Pet food brand, UK, exclusive, with marketing support
4.3%
−0.5 (bundled services)
3.8%
F
Pet health brand, UK, exclusive
4.2%
none
4.2%
G
Premium pet food brand, Europe, non-exclusive
4.1%
+0.5 (exclusivity)
4.6%
H
Pet food brand with a celebrity endorsement, exclusive
7.0%
none
7.0%
The range from the eight adjusted rates (QUARTILE.INC convention)
Statistic
Calculation
Result
Lower quartile
2.6% + 0.75 × (3.0% − 2.6%)
2.9%
Median
(3.4% + 3.8%) ÷ 2
3.6%
Upper quartile
4.2% + 0.25 × (4.6% − 4.2%)
4.3%
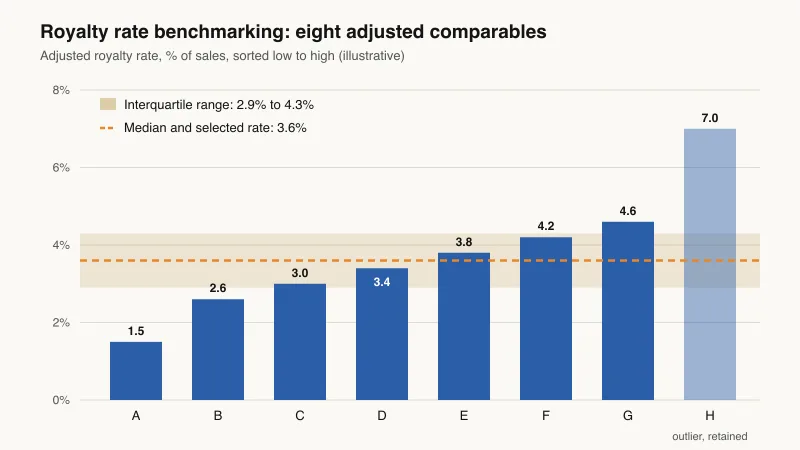
The quartiles are interpolated between observations, as the spreadsheet QUARTILE.INC function does. The median-of-halves convention gives 2.8% to 4.4% on the same data, which is why the convention belongs in the report. Comparable H sits well above the range; it stays in the data set, and the interquartile range keeps it from pulling the result upwards.
Royalty rate benchmarking: the eight adjusted comparables, the interquartile range and the selected rate (illustrative).
The subject brand is well established in its UK niche but not a category leader, so the median of 3.6% is selected. Profit split check: 3.6% ÷ 14.0% = 25.7% of operating profit goes to the licensor. The test is whether a brand that drives repeat purchase in a premium niche can account for about a quarter of the profit, and here it can.
ℹ Note
25.7% happens to sit close to the old 25% heuristic. That is a coincidence of this example and proves nothing on its own: the comparables, not the heuristic, set the rate.
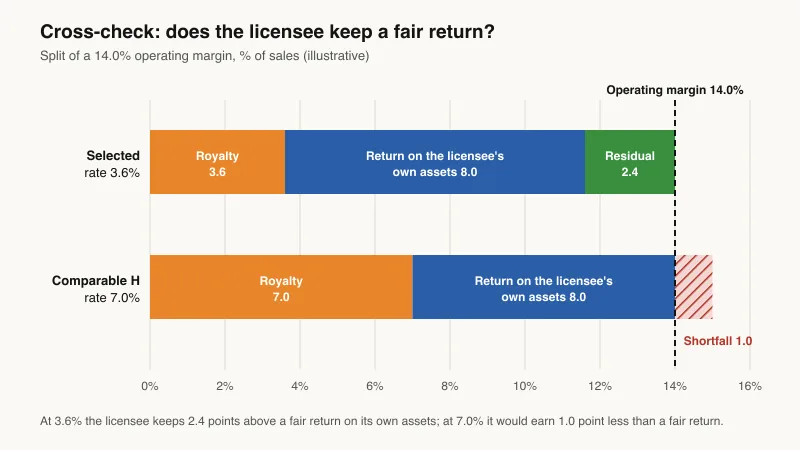
Return on capital check: the licensee keeps 14.0% − 3.6% = 10.4% of sales. A fair return on its working capital, plant and workforce is estimated at 8.0% of sales, leaving a residual of 2.4%, so the rate passes. At comparable H's 7.0%, the licensee would keep 7.0% against an 8.0% requirement, a shortfall of 1.0 point, which confirms that H describes a different kind of asset.
The return on capital cross-check: what the licensee keeps at the selected rate and at the outlier's rate (illustrative).
Into relief from royalty: the royalty saved in year 1 is £20.0m × 3.6% = £720,000 before tax and, after UK corporation tax at 25%, £540,000. Holding sales flat for a ten-year life and discounting at 12% at the end of each year (annuity factor 5.6502), the value before any tax amortisation benefit is £540,000 × 5.6502 = £3.05m. At the quartiles the same calculation gives £2.46m (2.9%) and £3.64m (4.3%), 19.4% either side, because the value is proportional to the rate. A mid-year discounting convention would raise each figure by the same 5.8%.
A reviewer should be able to repeat the benchmark from the file.
What the benchmarking file should record
Stage
Record
Subject
The licence being priced: asset, territory, exclusivity, term and royalty base
Search
Databases searched, search terms, date and number of results
Screening
Every rejected agreement and the screen it failed
Adjustment
Every adjustment, its size and its evidence
Range and selection
The quartile convention, the range and the reason for the selected point
Cross-checks
The profit split and return on capital checks, with their inputs
For a quick, indicative read on one asset, Opagio's free Single-Asset Value Check runs relief from royalty using a published median royalty rate for the asset type you choose, shows the rate it applied and its source, and labels the result illustrative; it is a starting point, not a benchmark. For client work, the Asset Valuator in Opagio Intangibles runs relief from royalty on the rate you have benchmarked, with a sensitivity table to show the value as the rate and the discount rate move, and a tax amortisation benefit toggle. Practices that run this across several clients can see how it fits their engagements on Opagio for advisors and practitioners.
The Bottom Line
Royalty rate benchmarking is what turns the most influential assumption in relief from royalty into evidence. Search more than one source, screen and adjust openly, summarise with the interquartile range, select a point for a stated reason, and prove the rate leaves the licensee a fair return. The 25% rule is not a substitute for any of these steps.
Frequently Asked Questions
What is royalty rate benchmarking?
It is the process of deriving an arm's-length royalty rate for an intangible asset from comparable licensing agreements: searching licensing data, screening and adjusting the comparables, summarising them as a range (usually the interquartile range), selecting a rate, and checking it against the licensee's profits.
Where do you find comparable licensing data?
In commercial royalty databases, in licences filed as exhibits with the US SEC, in court decisions on reasonable royalties and FRAND rates, in transfer pricing studies, and in the subject company's own licences. Our FAQ on how to select comparable royalty rates summarises the selection steps.
What are typical royalty rates by industry?
Rates vary widely within each industry, so a sector average is a weak guide. They tend to be higher where licensee margins are high and the IP drives the purchase, and lower in thin-margin or heavily cross-licensed sectors. Any published range should be cited with its source, date and sample, and used only as a sense check.
Is the 25% rule still used?
Not as evidence. The US Federal Circuit rejected it in Uniloc v Microsoft (2011), and the OECD Transfer Pricing Guidelines say a rule of thumb cannot show that a split of income between licensor and licensee is arm's length. A profit split comparison is still a useful sense check on a rate derived from comparables.
Should you use the median or another point in the interquartile range?
The median is the usual default. Another point can be justified when the subject asset is demonstrably stronger or weaker than the typical comparable, or when the purpose requires caution, as in valuing IP as loan collateral, where valuers often take the low end of the range.
Ivan Gowan is the Founder and CEO of Opagio. His experience licensing technology platforms at IG Group and across the fintech sector provides practical insight into the commercial dynamics that drive licensing rates. Meet the team.
How intangible asset valuations are used for tax purposes, including tax amortisation benefits in acquisitions, transfer pricing for intercompany transactions, and the key differences between tax and financial reporting valuations.
How to value trade names and trademarks using the Relief from Royalty method. Covers royalty rate selection for marketing-related intangibles, useful life considerations for brands, and the factors that distinguish a valuable trade name from a generic one.
A practical guide to valuing technology intangible assets — including proprietary software, patents, and developed technology — using the Relief from Royalty method and alternative approaches.
The practical challenges of valuing intangible assets in cross-border transactions. Covers jurisdictional differences in recognition, transfer pricing complications, currency considerations, and strategies for managing multi-country purchase price allocations.
We use essential cookies to make our website work. We'd also like to use analytics cookies to improve your experience. You can manage your preferences at any time.
Cookie Policy