Our Data Processing Agreement changes on 2 November 2026.
Version 3.0 corrects how it describes our AI providers: they keep submitted data for a limited period, principally to detect and prevent misuse, and their staff may review content flagged as potential misuse.
Read what is changing
Bank lending to high-growth firms: what the Bank of England's new data means for IP-rich businesses
By Tony Hillier· 2026-10-03bank lending to high-growth firmsBank of Englandhigh-growth SMEsSME lendingIP-backed lendingintangible collateralENABLE Guaranteeloan maturity
On 1 October 2026 the Bank of England published an Insight, Examining bank lending to high-growth firms, as part of the Financial Policy Committee's Financial Stability and Growth series. It uses loan-level data reported under the Commercial Credit Data Sharing framework, combined with ONS business-structure data and PitchBook deal data, to ask a simple question: do the sectors where Britain's fastest-growing firms cluster get their fair share of bank credit?
The short answer is no. And the reason the Bank gives is one that owners of intangible-rich businesses will recognise immediately: the assets that create the value are the assets banks find hardest to lend against.
★ Key Takeaway
The UK's central bank now documents, with loan-level data, what many founders and owners have experienced first-hand. The sectors that drive productivity receive a disproportionately small, short-dated share of bank credit, and the Bank links this directly to the difficulty of collateralising intangible assets.
What the Bank of England found
The Insight defines a high-growth SME as a firm with turnover below £30 million and average annualised employment growth above 20% a year over three years. Using that definition, the findings are stark.
<30%of SME lending goes to the sectors holding nearly half of high-growth SMEs
~40%lower average outstanding balances in those sectors
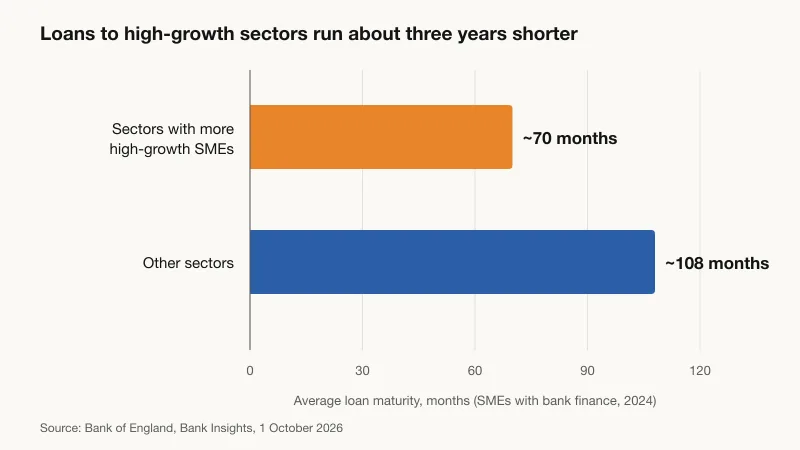
70 vs 108average loan maturity in months, high-growth sectors vs the rest
Bank lending to high-growth sectors vs other sectors (Bank of England, 2024 data)
Finding
Sectors with more high-growth SMEs
Other sectors
Share of high-growth SMEs
Nearly half (ICT, professional and scientific, administrative and support)
The remainder
Share of SME lending, 2024
Under 30%
Over 70%
Average outstanding balance (firms with bank finance)
Around 40% lower
Baseline
Average loan maturity
Around 70 months
Around 108 months
Most common credit type
Hire purchase (27%)
Mortgage (18%)
Two correlations stand out. Across sectors, the share of bank lending falls as the concentration of high-growth SMEs rises (a correlation of −0.35), and it also falls as productivity rises (−0.39, measured as output per hour, the gross value added per hour worked). The sectors that do the most to lift UK output per hour are, on average, the ones banks lend to least.
ICT is the clearest case. It carries the highest concentration of high-growth SMEs in the Bank's chart and one of the lowest shares of bank lending. It is also the sector with the largest share of private equity investment.
Why: the collateral problem
The Bank is explicit about the mechanism. High-growth businesses derive much of their value from intellectual property, software, data and organisational capital. These are difficult to pledge as security, which limits a lender's ability to recover losses on default, and so banks are less willing to extend large, long-term loans against them. It adds a second constraint: uncertainty. Fast-growing firms often prioritise expansion over near-term profit, and lenders may lack the know-how to assess projects with few collateralisable assets.
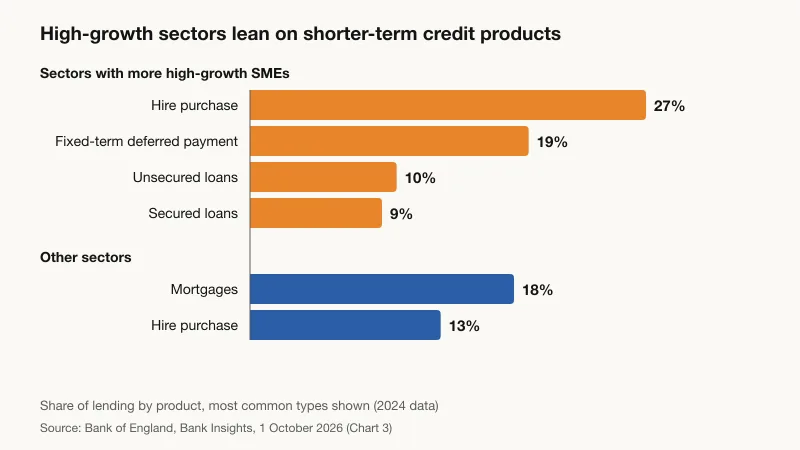
The type of credit that does reach these firms tells the same story. Hire purchase, secured on a specific, identifiable item, is the most common product, followed by fixed-term deferred payment. Mortgages, the long-dated product that tangible-heavy firms rely on, lead in other sectors instead. And for most product types the maturity gap persists even like for like: secured loans and mortgages to firms in high-growth sectors are shorter-dated than the same products elsewhere.
Bank lending to high-growth firms leans on shorter-term products. Source: Bank of England, Bank Insights, 1 October 2026 (Chart 3, 2024 data).
This is the collateral gap seen from the lender's book. Our earlier analysis of intangible assets and bank lending sets out the valuation and enforcement problems behind it in more depth; what is new is that the Bank of England has now measured the outcome.
✔ Example
A software business with £8 million of revenue, a recognised brand, proprietary code and multi-year customer contracts may own almost nothing a bank would traditionally take as security. Its laptops can be financed on hire purchase. Its code, which generates most of its value, typically cannot, unless it can be identified, evidenced and valued in a form a credit committee will accept.
Policy is moving, but guarantees do not value assets
The Insight notes that the Government announced in July 2026 that the British Business Bank had allocated £500 million within its ENABLE Guarantee programme to support lending to SMEs and scaling firms with significant IP assets. It also points to the FPC's December 2025 Financial Stability Report and a government-led working group under the Industrial Strategy focused on reducing barriers to lending against IP.
This matters, but it is worth being precise about what it does. ENABLE is a lender-side mechanism: it provides guarantee capacity behind accredited lenders' balance sheets. Businesses do not apply to it directly. A guarantee reduces the lender's exposure; it does not tell the lender what a borrower's software, brand or data is worth, whether it is legally owned, or whether it could be sold if things went wrong.
ℹ Note
As guarantee capacity becomes available, the binding constraint on IP-backed lending shifts from the availability of capital to the quality of evidence about the asset being lent against.
The UK bank programmes already operating show what that evidence unlocks. NatWest's IP-backed lending in England and Wales had lent £34 million by July 2026, with loans from £250,000 to £10 million against up to 50% of the assessed orderly-disposal value of the IP. Royal Bank of Scotland began IP-backed lending in Scotland in June 2026. HSBC's growth lending to scale-ups builds IP evaluation into its credit assessment, where the IP informs the credit decision rather than serving as formal collateral. Our summary of which UK banks lend against IP keeps the current list.
Why conservative evidence matters more than optimistic valuation
The category has had a credibility shock. Litigation over an IP-collateral insurance programme, alleging heavily inflated IP valuations, has made lenders wary of any number that cannot be traced back to evidence. The lesson for borrowers is counter-intuitive: the most persuasive case to a lender is rarely the highest valuation. It is the most defensible one.
A defensible case generally rests on four things:
Identification
A complete inventory of what the business owns, including assets that never appear on the balance sheet.
Ownership and protection
Clear title, registrations where they exist, and assignment of IP created by staff and contractors.
Evidence
Documents that show each asset exists, is used, and contributes to revenue: contracts, usage data, code repositories, registrations.
Lenders are not asking whether your intangibles are valuable. They are asking whether they can see them, rely on them and recover against them. Preparing that evidence is work a business can start long before it applies for a loan.
What the Bank did not say
The Insight is careful, and any reading of it should be too. The analysis is descriptive and does not establish causation. Its data excludes smaller and challenger banks, so it does not capture the whole lending landscape. The Bank states plainly that its findings do not imply banks are misallocating credit, nor that every high-growth SME is constrained. Some firms rationally prefer equity, and some need patient capital that bank debt is not designed to provide.
It also notes that equity is not a complete answer. UK venture activity totalled £14.4 billion in the first half of 2026, but almost 60% of deal value came from 18 megadeals and 71% from AI. The British Business Bank's equity tracker finds small-business equity investment has fallen in volume and number of deals. For the broad population of growing SMEs, particularly established owner-managed businesses, a large venture capital round is neither available nor wanted.
ℹ Note
A supporting survey point from 2023 is telling: among firms reporting under-investment, around one in five identified limited access to debt on reasonable terms as the main constraint.
What this means for owners of IP-rich businesses
If your business is in one of the sectors the Bank highlights, or simply derives most of its value from things you cannot touch, three practical conclusions follow.
Average loan maturity for SMEs with bank finance, high-growth sectors vs the rest. Source: Bank of England, Bank Insights, 1 October 2026.
Three practical conclusions
Expect your bank to see less than you do. The data shows that, by default, intangible-heavy firms receive smaller, shorter loans. That is the starting position, not a verdict on your business.
Treat evidence as a financing asset. The firms that access IP-backed lending are those that can present their intangible assets in a form a lender can assess. Building that record takes months, so start before you need the facility.
Think about timing alongside value. Shorter maturities mean higher monthly repayments for the same amount borrowed. Evidence that supports a longer-dated facility can materially improve cash flow, a point we examine in our companion article on the loan maturity gap for intangible-rich SMEs. Repayment capacity is the other half of the test, which our piece on DSCR for IP-backed loans explains.
Where to start
The Bank closes by calling for more research into how an increasingly intangible-intensive economy is financed. For owners, the more immediate question is whether their own business is legible to the people they want to borrow from. Our guide to IP-backed loans in the UK sets out what UK lenders look for, the borrower's guide walks through preparation, and the IP loan eligibility checker gives a quick read on whether your assets are likely to qualify.
Source: Bank of England, "Examining bank lending to high-growth firms", Bank Insights, 1 October 2026 (Bighelli, Karmakar, Miranda and Piton). Bank Insights articles do not necessarily represent the views of the Bank's policy committee members. NatWest, RBS and HSBC programme details reflect publicly reported information as at July 2026.
Share:
TH
Tony Hillier — Chairman, Co-Founder
MA, Balliol College, University of Oxford | Harvard Business School MBA with Distinction
Bank of England data shows UK SMEs in high-growth sectors borrow over about 70 months, against 108 elsewhere. What the loan maturity gap costs intangible-rich SMEs, and what evidence can change.
An IP collateral pack turns an intangible-asset audit into a credit-committee-ready bundle: ownership, valuation, evidence grading and collateral-suitability, ordered the way a lender reads.
Get the latest insights on intangible asset growth and productivity delivered to your inbox.
We use essential cookies to make our website work. We'd also like to use analytics cookies to improve your experience. You can manage your preferences at any time.
Cookie Policy